Understanding Raman spectroscopy requires knowledge of the properties of light.
Basics of Raman spectroscopy

Spectroscopy is the study of the interaction between matter and light. There are different types of spectroscopy, which are typically named after either the used light source (e.g. IR spectroscopy) or the process of light-matter interaction exploited. Raman spectroscopy is based on the inelastic light scattering in a substance where the incident light transfers energy to molecular vibrations. The scattered light can be detected by a Raman spectrometer and represents a “chemical fingerprint” of the substance. Based on such spectral information, a material can be identified or characterized.
Raman spectroscopy belongs to the group of vibrational spectroscopies. This article presents the fundamental principles of Raman spectroscopy and the basics of the measurement.
How does Raman spectroscopy work?
Properties of light
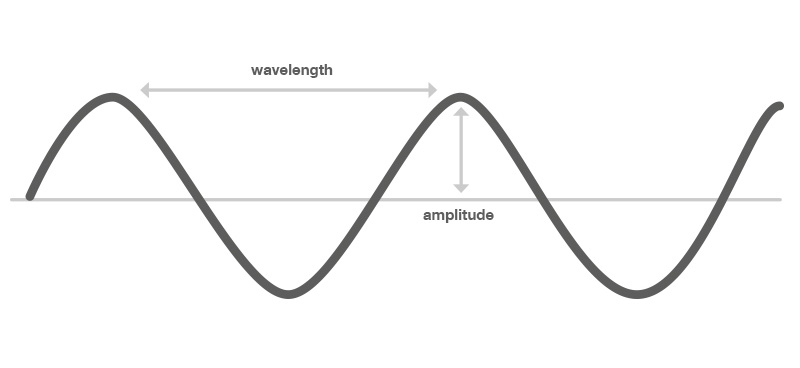
Figure 1: Light can be described as a wave.
Light is a form of electromagnetic radiation, which has both wave and particle (“photon”) properties. Light waves are usually mathematically described by a cosine function, where the two most important characteristic parameters are the wavelength (distance between two consecutive wave crests or troughs) and the amplitude (height of the waves over the baseline).
For a detailed discussion on this subject, see "What is light – a particle or a wave?"
Electromagnetic radiation propagates through space carrying a certain amount of electromagnetic energy. This energy is proportional to its frequency $\nu$ of oscillation, which is connected to the wavelength $\lambda$ by the speed of light $c$ (Equation 1):
$$\nu=\frac{c}{\lambda}$$
Equation 1: $\nu$ = frequency, $\lambda$ = wavelength, $c$ = speed of light
Therefore, a light wave (or photon) carries more energy E the larger the frequency or, alternatively, the smaller the wavelength is (Equation 2).
$$E ∝ \nu ∝ \frac{1}{\lambda}$$
Equation 2: $\nu$ = frequency, $\lambda$ = wavelength, $E$ = energy
For historical reasons, spectroscopists also like to use the wavenumber $ṽ$, which is defined as the reciprocal of the wavelength. The wavenumber is directly proportional to the energy of the photon (Equation 3) and usually expressed in units of reciprocal centimeters (cm–1) to give easy to read numbers.
$$ṽ=\frac{1}{\lambda}=\frac{\nu}{c}$$
Equation 3: $\nu$ = frequency, $\lambda$ = wavelength, $ṽ$ = wavenumber, $c$ = speed of light
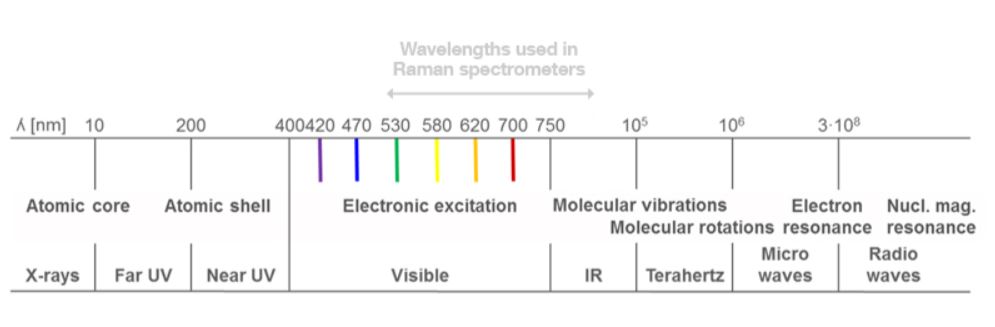
Figure 2: Electromagnetic spectrum: Depending on the energy of the electromagnetic radiation, different processes in atoms and molecules can be induced by the interaction between light and matter.
The above description is valid for a single light wave or photon. However, a light beam consists of many light waves with different frequencies propagating in the same direction. Each frequency contributes to the beam with intensity I (i.e. a certain number of photons per time interval). The intensity of a light beam is the quantity that is ultimately measured with the detector of a spectrometer.
The intensity distribution of all frequencies is called the spectrum of this light beam. Only a small part of the light frequencies can be seen by the human eye (“visible light”). Other spectral regions are e.g. microwave, infrared, ultra-violet (UV), or Röntgen (X-ray) radiation (Figure 2). For Raman spectroscopy, visible light or infrared (IR) light is used for the excitation.[1][2][3]
The most important physical parameters and their corresponding equations relevant for Raman spectroscopy are summarized in Table 1.
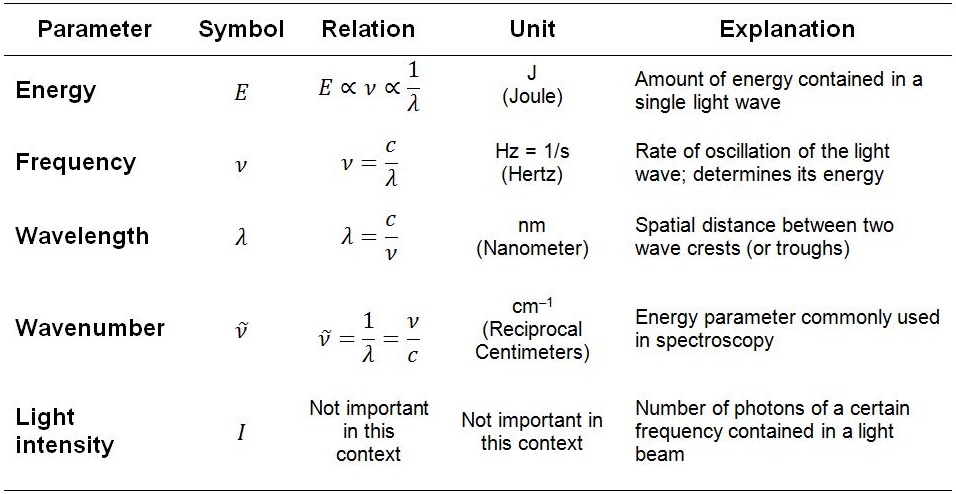
Table 1: Summary of light parameters
Light-matter interactions
When a light beam hits matter, it will interact with it in a specific way, dependent on the interplay between the light waves and the atoms and molecules that make up the matter. The interaction may leave the energy of matter and light unchanged (e.g. refraction, reflection, elastic scattering) or lead to an energy exchange between both. The processes used in spectroscopy to characterize matter belong to the latter category.
The transfer of energy from light to matter leads to an excitation. The following section outlines the most important excitation processes required to understand Raman spectroscopy: absorption, fluorescence, and scattering.[3]
Absorption
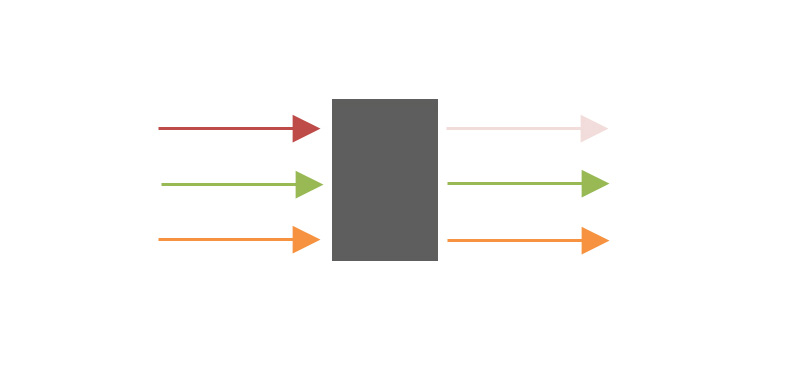
Figure 3: Absorption
Light energy in some parts of the electromagnetic spectrum is (partially) transferred to the matter.
This means some light waves pass through the matter without modification (transmission), while some light is absorbed by the sample.
Absorption: Some of the incident wavelengths are (partially) absorbed in the sample, while other wavelengths are transmitted without much loss in intensity. (Figure 3)
Fluorescence
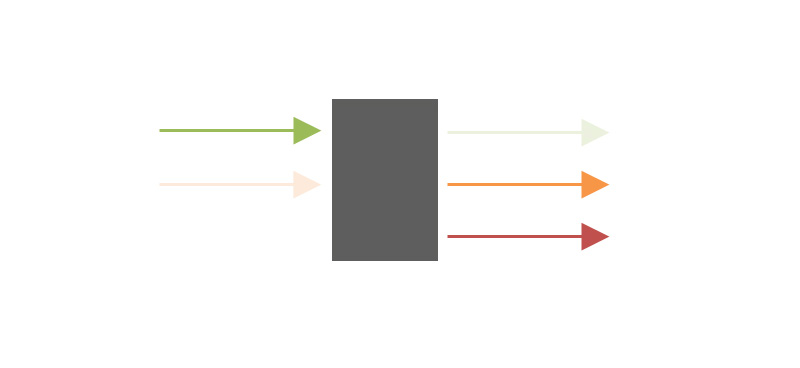
Figure 4: Fluorescence
Matter can reemit absorbed light again by an independent process called fluorescence. The emitted light has a different, longer wavelength than the originally absorbed light, which will result in a perceived “amplification” of some light wavelengths.
This is a particularly common process for colored samples and large biomolecules.
Fluorescence: The incident green light is absorbed (resulting in a loss in intensity) and reemitted in different, longer wavelengths (this results in a gain in intensity or even addition of new “colors”). (Figure 4)
Scattering
When an intense light source (e.g. a laser) hits a sample, part of the light will be scattered in different directions. The majority of the scattered light has the same wavelength (“color”) as the incident light – it is elastically scattered. This is why the human eye is able to “see” the spot of a laser pointer on the wall or table.
However, a tiny fraction of the scattered light interacts with the matter it hits in a way that it exchanges small amounts of energy, which is called inelastic scattering. The change in energy of the scattered light results in a changed frequency and wavelength.
The microscopic origin of this Raman interaction is an excitation or de-excitation of molecular vibrations in the matter. The characteristics of these vibrations determine the wavelength of the inelastically scattered light. From measuring the intensity distribution (spectrum) of the scattered light it is hence possible to deduce information about the vibrational structure of the substance illuminated. Therefore, Raman spectroscopy belongs to the group of vibrational spectroscopies.
Raman scattering: Most of the incident yellow light is scattered elastically in all directions. Small amounts of light, usually with higher wavelengths (orange, red), are also scattered inelastically after interaction with the molecules of the sample. (Figure 5)
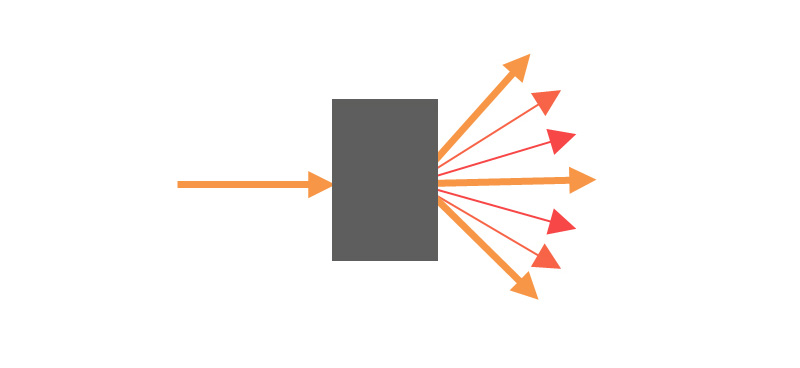
Figure 5: Raman scattering
Each of these processes can be exploited to extract information about the chemical and physical nature of the sample. The exact type and extent of molecular properties deducible depends on the type of spectroscopy used. The two main vibrational spectroscopies are infrared (IR) spectroscopy and Raman spectroscopy. Raman spectroscopy employs the Raman effect for the analysis of substances. The basics of Raman scattering are explained below.
Raman scattering theory (“the Raman effect”)
There are three scattering processes that are important for Raman spectroscopy and Raman imaging techniques:[3]
Anti-Stokes Raman scattering
Anti-Stokes Raman scattering is another inelastic scattering process. Here, a specific amount of energy is transferred from a molecular vibration to the photon. The scattered photon has higher energy and a lower wavelength than the incident photon. This process is even less likely to occur than Stokes scattering. Therefore, it is usually not used in Raman spectroscopy. The information extracted from anti-Stokes scattered light is mostly equivalent to the information extracted from Stokes scattered light, and only very specialized applications will require the extra effort to measure both scattering processes.
Stokes Raman scattering
Stokes Raman scattering is the inelastic scattering process that transfers energy from the light to a vibration of the molecule. Therefore, the scattered photon has lower energy and a higher wavelength than the incident photon. The amount of energy transferred is not arbitrary, it has to be exactly the amount required to excite one of the molecular vibrations of the molecule. The composition of the scattered light is therefore highly dependent on the exact type of molecule (like a fingerprint). Stokes scattering is the most commonly exploited process to acquire a Raman spectrum. It is, however, several orders of magnitude less likely to occur compared to Rayleigh scattering, rendering it difficult to detect.
Rayleigh scattering
Rayleigh scattering is the term used for elastic scattering of light by molecules, and is by far the most dominant scattering process. The interaction does not change the energy state of the molecule and as such the scattered photon has the same color (wavelength) as the incident photon. In a Raman spectrometer, the Rayleigh scattered light has to be removed from the collected light, otherwise it would obscure the Raman signals.
Table 2 summarizes the scattering processes relevant for Raman spectroscopy:
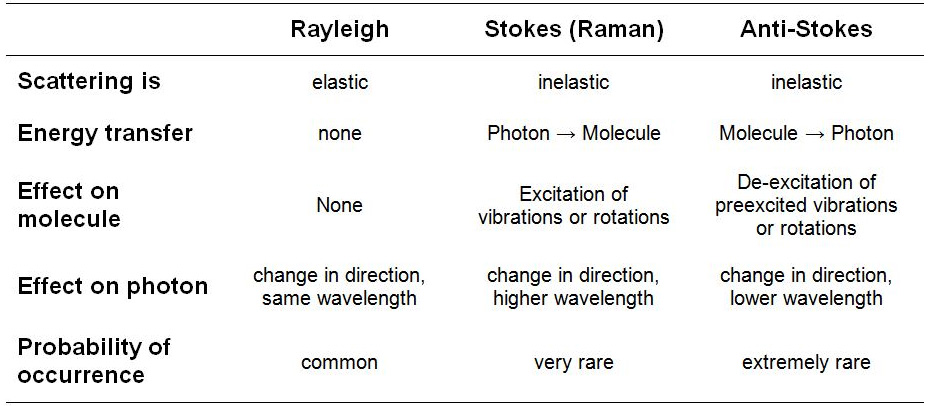
Table 2: Summary of the scattering processes relevant for Raman spectroscopy
Vibrational spectroscopy – interpretation of a Raman spectrum
All vibrational spectroscopies characterize molecular vibrations and to a smaller extent also molecular rotations. Molecular vibrations are based on the movements of the individual atoms of the molecule relative to each other. The forces keeping the molecule together will act like small springs connecting the atoms as illustrated in figure 6.
The set of vibrations is highly dependent on the exact structure of the molecule and therefore comprise a unique vibrational spectrum. This makes vibrational spectroscopy an ideal tool for substance identification. In fact, the vibrational spectrum is so unique that it (or more precisely part of it) is often referred to as the “chemical fingerprint” of the molecule.
Different vibrational spectroscopies can detect a different subset of the full vibrational spectrum, which is why the most common methods in this class, Raman and (FT-)IR, are often referred to as "complementary methods".[1][2]
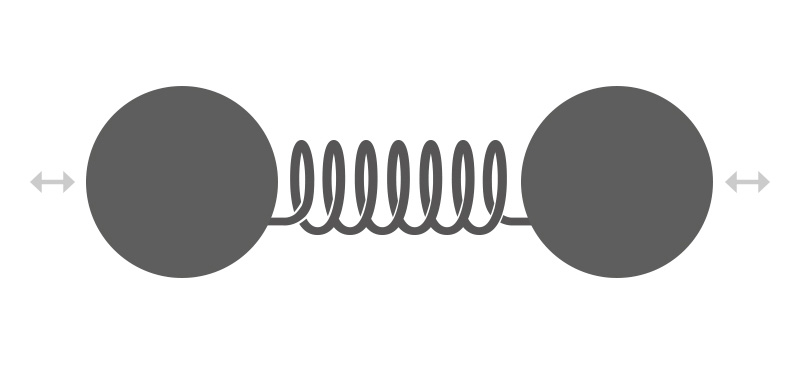
Figure 6: Vibration of a diatomic molecule in a simplified representation
When is a molecule Raman-active?
Raman spectroscopy detects changes in the polarizability of a molecule. It therefore only detects vibrations where the polarizability changes during the movement (these are Raman-active vibrations)
- Polarizability describes how easily the electron cloud around a molecule can be distorted.
- A change in polarizability is, for example, caused by an increase in the size of the electron cloud.
- One example of a vibrational motion increasing the size of the (local) electron cloud of a molecule is a symmetric stretching vibration (figure 7).
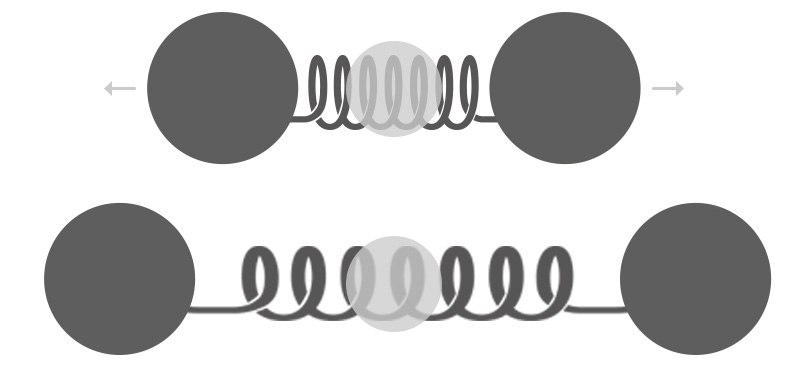
Figure 7: The symmetric stretching vibration of carbon dioxide (CO2) increases the size of the electron cloud. It is therefore Raman-active.
Visualization of Raman spectra
Commonly accepted practice is to plot Raman spectra in a plot "Count Rate" vs. "Raman Shift".
The Raman shift is the energy difference between the incident (laser) light and the scattered (detected) light. This difference is then only connected to the energetic properties of the molecular vibrations studied and hence independent of the laser wavelength. The Raman shift is usually expressed in wavenumbers.
The count rate is the number of events the detector registers for the respective Raman shift per second of detector integration. It is proportional to the intensity of the light imaged to the detector.
Interpretation of Raman spectra
There are a number of approaches which can be used to interpret Raman spectra, including the three described below.
By identifying functional groups within molecules
The vibrations of certain distinct subunits of a molecule, called its functional groups, will appear in a Raman spectrum at characteristic Raman shifts. Such a shift is similar for all molecules containing the same functional group. These signals are particularly useful when monitoring reactions which involve these functional groups (oxidation, polymerization, etc.), since they provide a direct measure of the progress during the reaction.
Using these characteristic shifts makes it possible to relate the spectrum of an unknown compound to a class of substances, for example the stretching vibration of the carbonyl group in an aldehyde is always in the range of 1730 cm–1 to 1700 cm–1. Figure 8 demonstrates the Raman spectrum of benzonitrile containing the stretching vibration of the cyano-group (CN) of benzonitrile at a characteristic value of 2229.4 cm-1.[4]
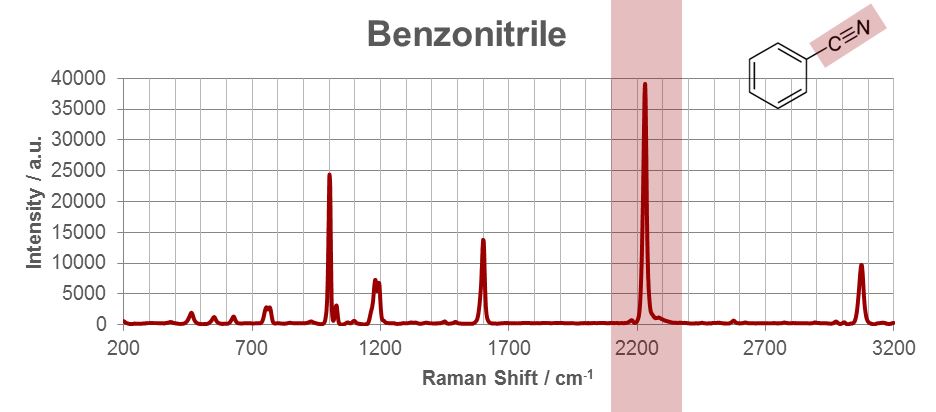
Figure 8: Raman spectrum of benzonitrile and the stretching vibration of the cyano-group (CN) of benzonitrile at 2229.4 cm-1 (red).
Using the characteristic "fingerprint region"
Apart from the molecular vibrations of specific functional groups, vibrations of the molecular scaffolding (skeletal vibrations) can be detected in a Raman spectrum.
Skeletal vibrations are usually found at Raman shifts below 1500 cm–1 and have a substance-specific, characteristic pattern. This region, often referred to as the “fingerprint” region of a substance, is the most important part of the spectrum for identification purposes.[5]
With computer-aided interpretation software
Substance identification using Raman spectroscopy is nowadays carried out by using software containing a comparison algorithm and a spectral database. The result is shown as a matching factor – the Hit Quality Index (HQI). This factor ranges from 0 (for “no match”) to 100 (for “exact match”).
The user may then define a threshold down to which the HQI is interpreted as a match.
In this way substance identification is possible within seconds and non-technical users can easily interpret the results.
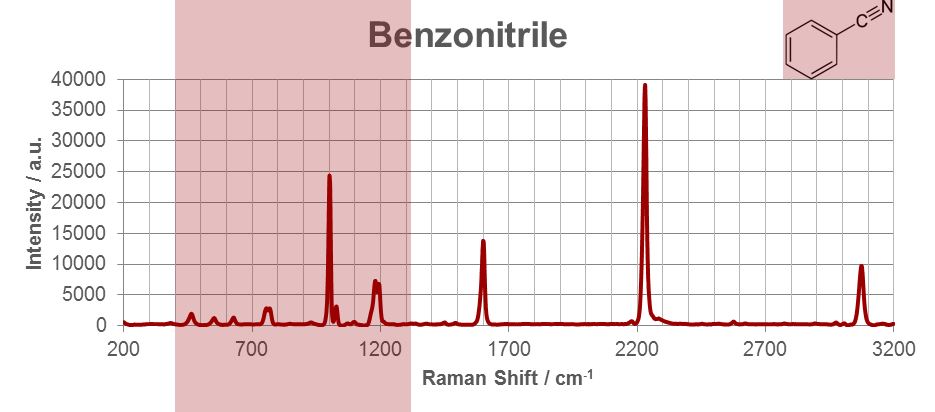
Figure 9: Raman spectrum of benzonitrile and the skeletal vibration region (chemical fingerprint region) (red).
Conclusion
Raman spectroscopy is one type of vibrational spectroscopy which requires good understanding of the properties of light. It provides a chemical “fingerprint” of the substance measured and is therefore frequently used whenever unknown materials need to be identified.
However, obtaining a Raman spectrum is just the start: after visualizing the data, you need to interpret the Raman image.
For more information on the measurement principle and uses of Raman spectroscopy, see "How can Raman spectroscopy help you?"
Find out here which Raman analyzer would be best for you.
References
1. Hollas, J. M. (2004). Modern Spectroscopy. 4th Edition. Chichester, UK: John Wiley & Sons.
2. Long, D. A. (2002). The Raman Effect – A Unified Treatment of the theory of Raman Scattering by Molecules. Chichester, UK: John Wiley & Sons.
3. McCreery, R. L. (2000). Raman Spectroscopy for Chemical Analysis. New York, USA: John Wiley & Sons.
4. ASTM E1840-96 (2014)
5. Hesse, M., Meier, H. and Zeeh, B. (2005). Spektroskopische Methoden in der organischen Chemie. Stuttgart: Georg Thieme Verlag.